Grocery retailers face a unique set of advantages and challenges within the retail sector. While many retailers of discretionary products have suffered during the COVID-19 lockdowns, grocery has experienced the opposite with consumers needing to buy more household goods and food than usual. While the uniqueness of grocery in the retail sector has set it apart in an arguably positive way during the COVID-19 crisis, it also has its own challenges such as perishable inventory, reliance on just-in-time supply chain flows, and the traditional use of price promotions, circulars, and coupons to move products.
With narrowing margins, continual competition, and the “new normal” of shifting product demands in a post-COVID 19 world, grocery retailers are always looking for an edge over their competitors. Now more than ever, every penny counts to retailers as much as consumers. That is why, as we emerge from the recent crisis in which grocery retailers have focused on keeping up with demand, the print circular will resume its important role in grocery promotion strategy.
Now, especially as consumer grocery habits are changing, is the time for grocery retailers to get more sophisticated with their use of the weekly flyer. Too often, the weekly circular is based on the version used one year earlier without critical analysis, failing to maximize its potential effectiveness. The power of the weekly sales flyer is further limited because it cannot be personalized and usually is the same across pricing zones or geographic markets. It doesn’t have to be this way. Circular ad effectiveness can be easily analyzed and boosted with the right data solution.
So how can grocery retailers alter their approach to the weekly circular to minimize unnecessary discounts and boost profits with analytics? Keep reading to learn more.

Grocery retailers have vast but underutilized data assets
Grocery retailers have access to more granular price and promotion impacts than ever before through the Point of Sale (POS) systems that capture data for each item sold including discounts, coupons, loyalty rewards, date-time, location and tender type. While grocery retailers know they have the data to optimize their offerings, they often lack the right tool to efficiently organize and analyze that data. Even a retail chain with small market share of the grocery sector will require “big data” style infrastructure and analytics in order to gain the valuable promotional insights from the POS data that accumulates in a year’s time.
Without the proper insight, retailers could be discounting items that don’t need to go on sale, causing them to miss out on needed revenue. Similar missed opportunities come from not promoting complementary products that could maximize sales lift. The solution is to build, or partner with a company that knows how to help build, an effective data science platform utilizing historical POS data and predictive analytics. The application of statistical models and data visualization to the vast POS data brings order to chaos, allowing analysis to become operationalized and data to become tangibly useful.
The support of a Circular Optimizer
Representing only a subset of all items on sale that week, the weekly circular is designed to highlight items that will drive trips, build baskets and promote various vendor programs. Unlike the digital circular, the print version cannot be personalized to the customer and often is the same across pricing zones or geographic markets. A “circular optimizer” would ideally customize a circular down to the market or even store level.
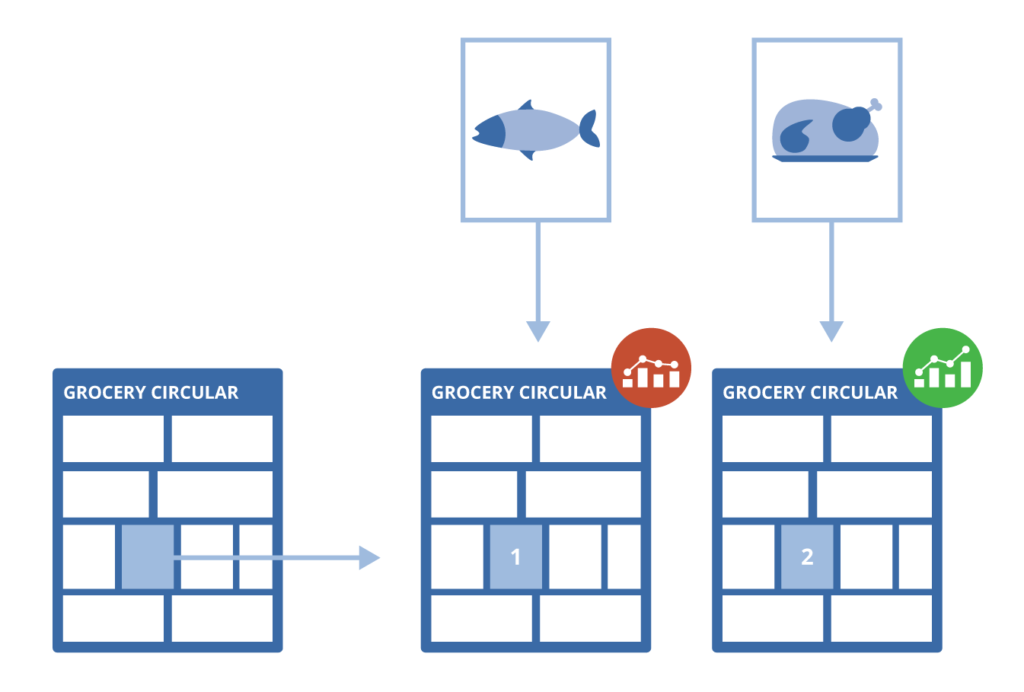
A robust data analytics tool (such as Fulcrum’s RetailViewer™) can provide circular optimization by calculating, with just a few mouse clicks, the forecasted sales and quantity for each item that might be included in a weekly circular based on the promotion price and location within the circular. A high-end circular optimizer also will use predictive models to forecast the number of households each product ad appeals to and the incremental appeal given the others ads in the circular. In many cases, there is significant overlap in appeal across ads. Swapping out an ad with little incremental value with one that appeals to a different group of households broadens the appeal of the entire circular, in turn driving more trips, bigger baskets, and greater revenue.
Ideally, retailers would be able to use the same tool to build a circular by inserting product ads into an empty circular form based on informed performance insights. Versions of the circular could then be created and saved by filtering the forecasted appeal and incremental appeal by region, market, zip code, etc. Fulcrum’s Circular Optimizer™ is a feature of RetailViewer and provides this functionality and flexibility. It can be hosted on premises or within Fulcrum’s highly secure private cloud.
Looking forward
While some aspects of grocery retail may be forever changed due to COVID-19, the need for evaluating the impact of price and promotion decisions on sales through a data-driven process will persist. The use of data science to squeeze the most value from every promotional effort is the new norm and grocery retailers that master this practice will be better ensured of future success.
Fulcrum Analytics has been delivering solutions for the grocery industry with both custom consulting and its data harnessing products for over a decade, including our Circular Optimizer. We construct big-data solutions and innovative analytical models and applications that take into consideration the nuances found in high-frequency retail in general and grocery in particular. These solutions help our clients make informed promotional decisions quickly to increase penetration and minimize unnecessary discounts. To learn more about how Fulcrum’s RetailViewer and Circular Optimizer can set your business up for success, contact us today.