
From business managers, to data scientists, to UX developers — anyone who works with data knows anomalies can be a chore to find and an even bigger chore to resolve. Incorrect or faulty data can cause a business to miss revenue opportunities or potentially make poor business decisions based on erroneous analysis. For organizations whose processes rely on unifying customer or employee data sources, or that are facing regulatory scrutiny, managing risks associated with data quality is always a high priority.
Many organizations rely on operational business rules during the ETL process to flag data that is outside of predefined parameters, but such business rules are unable to capture nuanced fluctuations in the data, such as a long period of borderline-acceptable data or a continual but gradual shift in means or standards in the data.
Accurately detecting and dealing with data anomalies is often tricky, but it doesn’t have to be. Fulcrum recently helped one of the top 10 banks in the USA innovate the formerly tedious task of troubleshooting outlier data, leading to data-driven decision making that was both faster and more accurate with the deployment of its automated ML-driven Data Anomaly Detector.
Data Anomaly Detector in action
Recently our client, PNC Financial Services Group, was concerned with data elements received from third party platforms having an impact downstream on business reporting and other critical data records. Especially in highly regulated banking, accuracy of this data of critical importance. Fulcrum partnered with PNC on a proof of concept project to innovate processes within the client’s development environment to optimize data quality by:
- Detecting anomalous distributions
- Utilizing multiple detection algorithms
- Alerting users to anomalies via a trigger notification system
- “Learning” over time through model training
- Measuring the impact of configuration/threshold changes on alert triggers
- Executing on a regular schedule
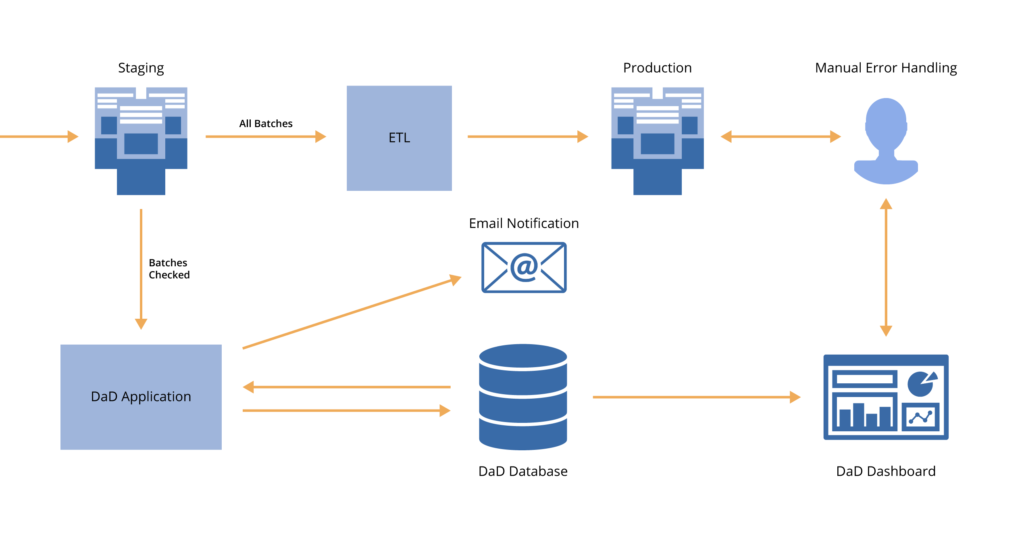
Before our Data Anomaly Detector (DAD) was deployed, validation rules for incoming data required manually written and tested aggregate values of incoming data batches. Fulcrum deployed its automated ML-driven Data Anomaly Detector to improve upon the data anomaly detection process, working in parallel with the ETL process, alerting the operations team to any anomalies in need of attention and keeping track of them in a dashboard report. During this phase, the data engineers could review and compare the flags and alerts of the two systems as they attended to the anomalies. As part of the deployment testing, artificial anomalies were introduced to demonstrate capabilities and help tune the configurations.
With this setup, DAD is limited to alerting engineers of potential data issues without directly altering the data pipeline.
An alternative setup is to direct data conditional on the DAD test outcomes. This is a more automated system where only validated “Good” batches are sent through the ETL process and into production, while the batches with questionable patterns or records are routed to staging for review and release prior to being integrated into the production-level dataset.
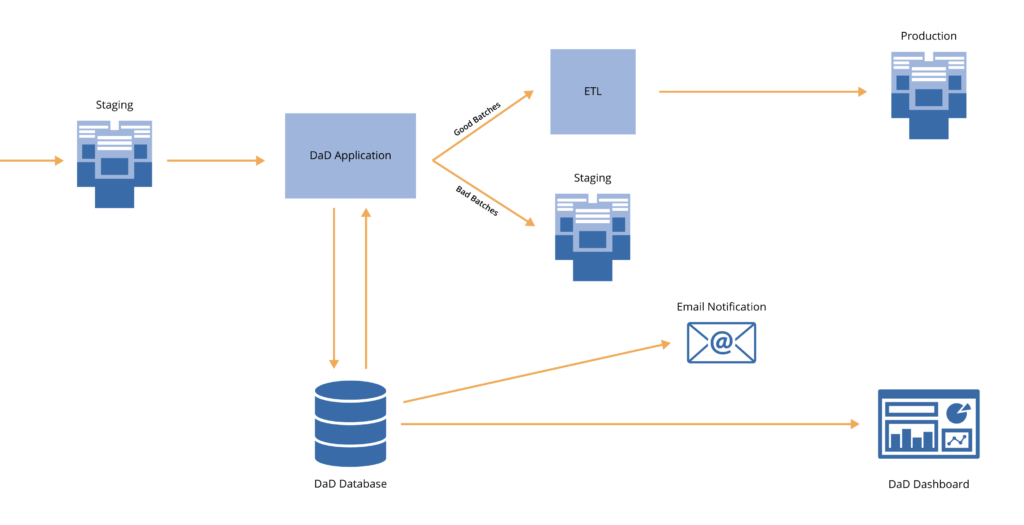
Through this deployment, the client will be able to improve upon the accuracy of business reporting with the removal of erroneous data before it is published and utilized at the production-level. The DAD parameters can be modified and calibrated by the client’s own team going forward for maximum customization and sensitivity control.
DAD’s capabilities
Fulcrum’s ML-driven DAD applies cutting edge machine learning applications and data visualization to information technology systems historically run by SQL logic. It modernizes data anomaly detection by identifying unusual patterns in live data feeds with a minimal amount of user input or oversight, and becomes more effective as the user interacts with it. DAD leverages a blend of user context knowledge and machine learning methodology to automatically hone in on outliers and less obvious long-term trends or patterns in data. By recording the history of the anomalies, the DAD Dashboard is a centralized source of information for audit transparency in cases of regulated processes. The DAD Dashboard is a web-based user interface that tracks the status of Runs, Alerts, Configuration, and Expectations.

The DAD Database contains the configuration of the machine-learning code, the user-specified Batch/Column expectations, and the record of the job and alert history. It can be hosted within a client’s own technical environment or within one of Fulcrum’s cloud-based environments.
The team behind DAD
Though our most recent client was in the banking space, the automated ML-driven Data Anomaly Detector innovates data anomaly detection in any industry. From companies who just need a little support to those who need a total overhaul in operationalizing data quality processes, we provide experienced developers, engineers, and data scientists to build data pipelines into a centralized database or data warehouse, build code to streamline data flows, and alert users to critical anomalies.
To learn more about how Fulcrum can help you with Data Anomaly Detection to detect insights, automate your data processes, reduce costs and unlock value yet to be generated from your data streams, contact us today.