As data science becomes a key factor in the decision making process of society, along with that comes the democratization of data analysis allowing anyone, not just statisticians, to draw conclusions from data. There is an undeniable ease to summary statistics that makes them appealing, but here at Fulcrum, we often encounter clients throwing away the distributions in their data science exercises which creates risk for their organizations.
Let’s walk through a hypothetical game to illustrate an example of the risks, and why individuals and businesses should be wary of falling back on summary statistics when making decisions.
Improving Decision Making in Predictive Modeling
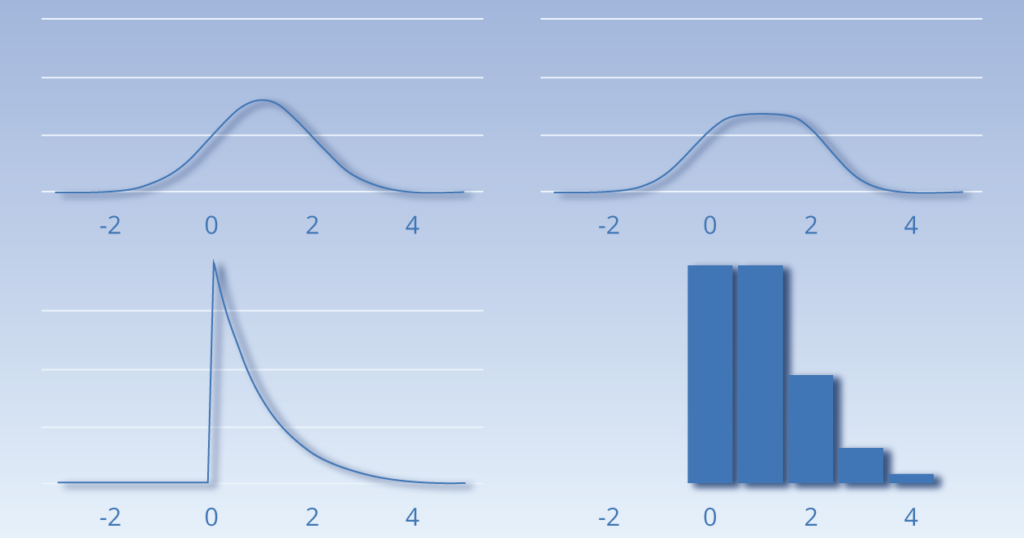
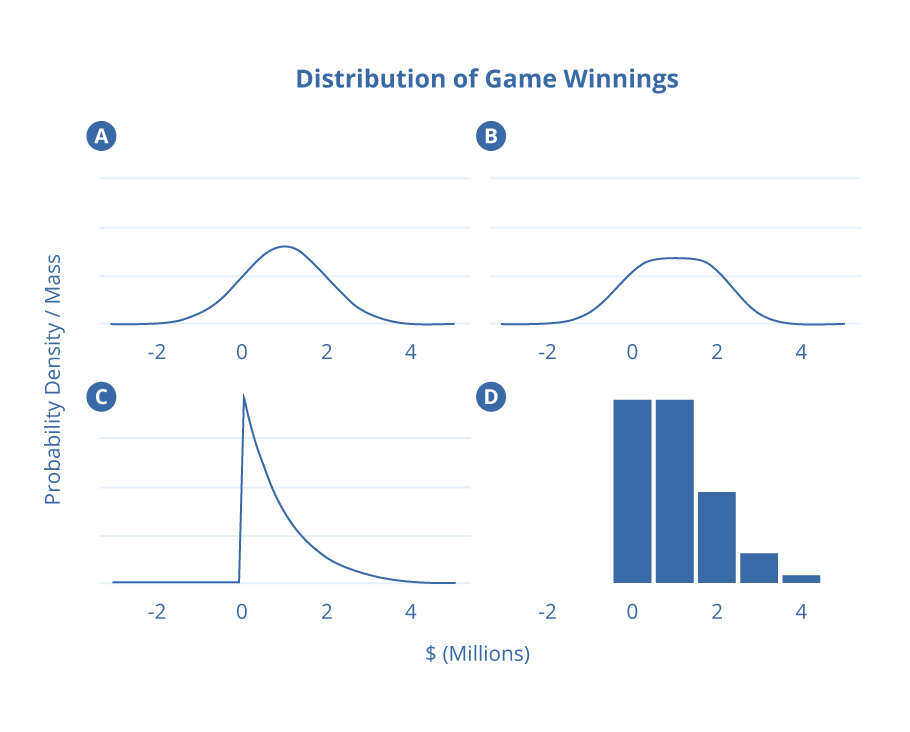
Imagine you’re given an opportunity to play a game. The rules are straight-forward: if you decide to play, you simply have to choose one of the four distributions depicted below. An observation will be drawn at random from the distribution you select and you will win the corresponding number of dollars. For example, an observed value of $1.65 million would correspond to you winning $1.65 million and an observed value of -$100,000 would correspond to you losing $100,000. You only get to play the game at most once. Would you choose to play, and if so, which of the distributions would you select?
A common approach is to try to optimize the expected value of the game. Keeping in mind that not playing has an expected value of $0, the argument goes that you should consider the expected value (mean) of each distribution and select the distribution with the greatest such value, provided that it’s greater than zero. Each of the four distributions in this game has the same mean, namely $1,000,000, and so you can expect to win $1,000,000 regardless of which distribution you select. This line of reasoning would lead you to conclude that you should opt to play but be ambivalent about the choice of distribution.
Problem solved, right? If you were to ask this question to a stock trader, they might disagree. They would likely caution that it’s not enough to consider expected return without also considering the degree of risk. As most professionals in finance will attest, high returns often come attached with high risks. But how do we quantify this risk?
Companies are increasingly reliant on predictive modeling and analytics to help make decisions in the face of uncertainty. Machine learning models output predictions, and most of these are little more than single values (or point estimates in statistical jargon) of unknown quantities.
A common measure of risk associated with a distribution is its variance, and a corresponding unitless measure of the risk/reward ratio is the ratio of the square root of the variance (aka, the standard deviation) to the expected value of the distribution. Rather than choose the distribution that maximizes the expected value, a more reasoned approach might be to consider the distribution that minimizes this ratio, commonly referred to as the coefficient of variation.
This all seems sensible, but as it turns out, each of the four distributions has a standard deviation of $1,000,000 and therefore each has the exact same coefficient of variation. Once again, you are left to conclude that you should play the game but be agnostic to the choice of distribution.
Shape Matters
Consider your options from a different angle — if you choose the normal distribution depicted in (A), there is a 16% chance of losing money and a 2.5% chance of losing $1,000,000 or more. That may not be a risk you can afford to take. On the other hand, neither (C) nor (D) leaves you with any chance of losing money, and the continuous distribution depicted in (C) even guarantees you a profit.
How might we weigh these considerations more systematically? There are various approaches, but one reasonable way is to try to quantify the relative value of various game winnings by constructing a utility function. An advantage of this approach is its flexibility. After all, one person’s aversion to risk is not likely to be the same as another, and customized utility functions can help to capture these differences. For the game in question, we consider two hypothetical scenarios along with their corresponding utility functions shown here.

The first we will call our “Billionaire scenario”. The associated utility function attempts to quantify the idea that to an extremely wealthy individual, losing $1 million might be as bad as winning $1 million is good. In other words, there’s a symmetry to the function about zero. The linear shape of the function also encapsulates the idea that winning twice as much money yields twice as much value. The second scenario we refer to as our “Typical Person scenario”. Unlike in our Billionaire scenario, the associated utility function is not symmetric about zero and represents the idea that losing money is very bad for the typical individual, especially in large amounts. Note that the utility value falls exponentially as game losses mount.
Given a distribution and a utility function, we are now able to calculate the expected utility value. The table below shows the expected utility values for each combination of distribution and utility function that we have considered thus far.
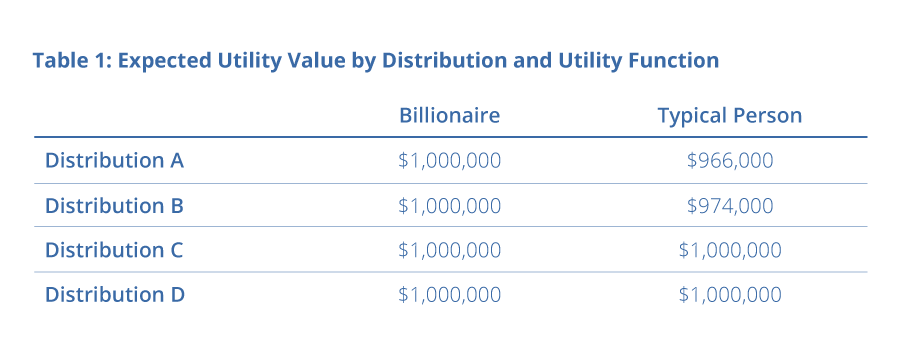
Notice that the choice of distribution has no impact on the expected utility value for our hypothetical Billionaire, but does impact the expected utility value for our hypothetical Typical Person. In this latter scenario, we see that the expected value is maximized by selecting one of the non-negative distributions, C or D. This is congruent with our earlier intuition that these distributions may be better choices because they avoid any downside risk.
An Important Lesson for Business Decision Making
The lesson from our imaginary game is to be wary of relying on summary statistics in making decisions. Recall how we began by comparing expected values and progressed to additionally considering standard deviations. As we discovered, it wasn’t until we regarded the full shape of each distribution that we were able to properly assess the risk of each choice and reach a satisfactory conclusion.
Companies are increasingly reliant on predictive modeling and analytics to help make decisions in the face of uncertainty. Machine learning models output predictions, and most of these are little more than single values (or point estimates in statistical jargon) of unknown quantities. For example, a stock analyst might report that a company’s earnings are predicted to be $1.50 per share this year. The estimate, $1.50, includes no indication of the degree of uncertainty. The uncertainty of such an estimate, if even considered, is typically quantified by computing the prediction error. Hence, for example, you might see a forecast for next quarter’s liability costs that looks something like $1,000,000 ± $300,000. Is this an acceptable amount of liability? As we saw in our game, it’s hard to say when we don’t have the full information about the prediction distribution available.
The Fulcrum Approach
Working with distributions can be clunky in the most commonly used programming languages among data analysts. Furthermore, we believe that one of the most significant reasons why distributions are often overlooked is a lack of native software support. For example, in Python, R, and Excel, it is easy to declare two variables as integers and compute their sum. There is no equivalent way without writing a lot of custom code to declare one variable as a normal distribution and then add it to another distribution that is, say, empirically observed. By using the easier, more straightforward approach, businesses risk overly simplifying model outcomes, rendering the predictions to be less reliable compared to a holistic approach that takes the distribution of possible outcomes into consideration.
At Fulcrum Analytics, our mission is to help companies make better decisions around risk and uncertainty. We know that making smart decisions requires consideration of all the information available, not just a summary. We recognize the importance of distributional thinking to our mission, which is why it is central to how we approach analytics. We’ve been thinking carefully about the best ways to work with distributions and attempting to overcome the challenges they pose by developing code to let them be treated as first-class objects in our analytics workflows to improve upon the accuracy of resulting decision making.
…often times, businesses risk overly simplifying model outcomes, rendering the predictions to be less reliable compared to a holistic approach that takes the distribution of possible outcomes into consideration.
Whether you’re an insurance company trying to predict total claims costs for your stop-loss policies, or a bank trying to decide which transactions are anomalous and should be flagged as fraudulent, we’re ready to help you maximize the quality of your data analysis operations, to understand the full picture, and arrive at an optimal solution for your needs.