
A Hybrid Approach to Customer Segmentation: Combining Machine Learning and Rules-Based Methodologies
Author: Evie Fowler
Customer segmentation refers to the process of dividing customers into subgroups with similar buying habits and needs. It helps businesses understand their customers better so that they can market existing products more effectively and even develop new products to meet customer demands.
Approaches to Segmentation
Rules-Based
The best customer segmentations are easily interpretable. They tell stories about the customer base that make intuitive sense and root individual customers in a broader social context. The easiest way to deliver this kind of interpretability is with a rules-based segmentation: subject matter experts explain their archetypal customers to data scientists, who then look for data patterns to match the archetypes, and describe the buying behavior of each group. For example, a sporting goods manufacturer might know that it sells to “weekend warriors”, “soccer moms”, and “casual hobbyists”. Data scientists will be able to identify those cohorts in sales data – men aged 40+ with several high-end gear purchases, women aged 30-50 with mostly youth-sized purchases, and so on.
The power of this approach lies in its simplicity. It’s easy to categorize new customers, or even new prospects, according to the rules derived from historical sales data. It’s also easy for the product development team to know how to appeal to soccer moms, and for the marketing team to know what differentiates a weekend warrior from a casual hobbyist.
Of course, the simplicity of this approach is also a risk. Does this set of rules capture the unique complexity of a large customer base? More importantly, does this approach identify new patterns in our data? Or does it simply repeat and amplify conventional wisdom about our industry?
Machine Learning-Driven
Machine learning-driven customer segmentation, on the other hand, can be a powerful tool to identify new and unknown relationships between consumer traits and buying behavior. These segmentations are driven by machine learning clustering algorithms like k-means, dbscan, and spectral or agglomerative clustering. They allow for precise identification of customer subgroups.
Unlike rules-based approaches, however, these methods do not necessarily create linear divisions between customer segments. It can be difficult to determine what unifies all of the customers in one segment, and hard to describe what differentiates each group from the others. Data scientists must balance this explainability-performance tradeoff in deciding which approach to use.
A New Hybrid Approach
Here I will describe a multi-step approach to customer segmentation that elicits the unique positive attributes of both methods described above.
Observation
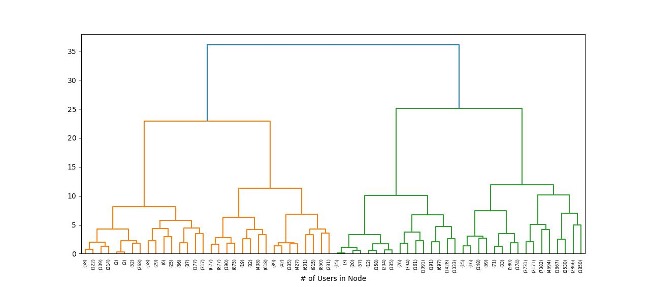
Any segmentation analysis should begin with a careful observation of customer data. It’s important to assess what information is available about the customer base. It is also crucial to explore whether there are naturally formed clusters in the data, and if so, how many. Choosing the correct number of segments can make or break the success of any segmentation analysis. Too few clusters can oversimplify the data, creating large segments with lots of internal variability and causing important patterns and insights to be missed. Too many clusters can result in a model that is difficult to interpret, with many segments only slightly different from each other.
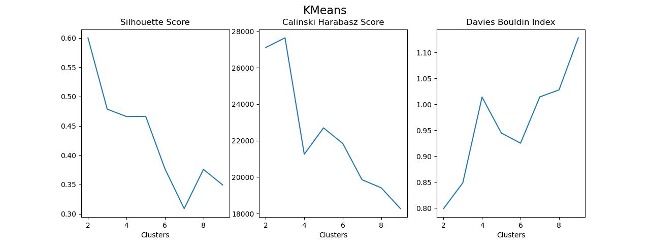
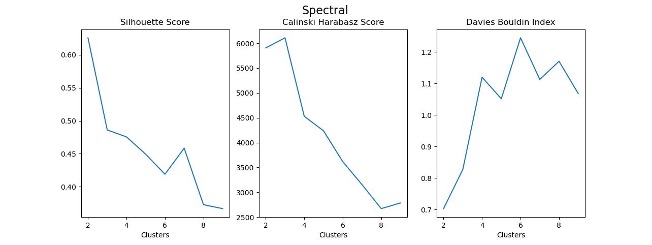
There are many metrics available to quantify this balance of in-group homogeneity and inter-group variability in order to assess the fit of a clustering model. At the beginning of a segmentation analysis, it’s a good idea to test a variety of clustering algorithms according to a variety of these metrics to determine the ideal number of clusters.
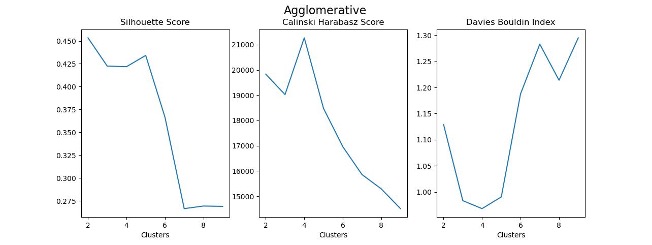
Machine Learning-Based Clustering
After identifying an appropriate number of segments and selecting a clustering algorithm, it’s time to fine-tune a clustering model to use as the source of truth for the rest of the project. Here, I’ve chosen to create three customer segments using an agglomerative clustering approach.
The next step is to try to understand what differentiates each cluster from the others. Traditionally, this is done by performing principal component analysis on the clustering data and labels to determine which input features contribute most to the variation and classification. This approach has drawbacks, though: principal component analysis assesses how much variance each feature contributes to the whole and returns weighted vectors describing those relationships. That type of analysis is not easily interpretable or immediately actionable.
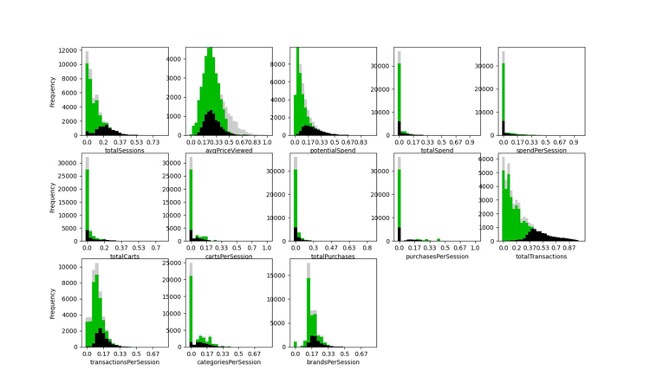
Instead, begin with further exploratory data analysis. It can be informative to view histograms of each feature that went into the clustering analysis, colored according to cluster label.
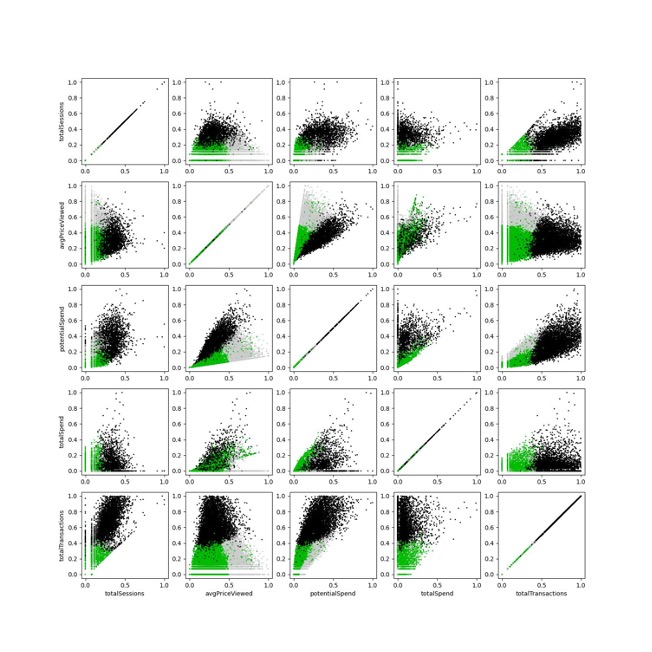
It can also be helpful to do the same thing with scatterplots of pairs of features from the analysis.
Linear Approximation
It’s still difficult to describe any cluster as a product of any pair of input features, but this is a useful motivation for the following.
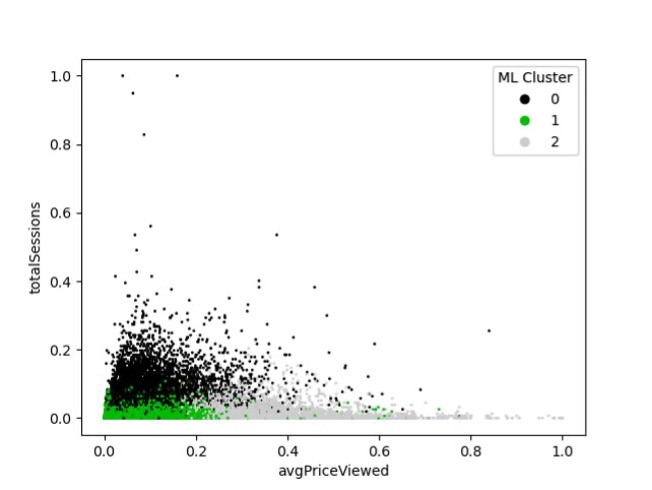
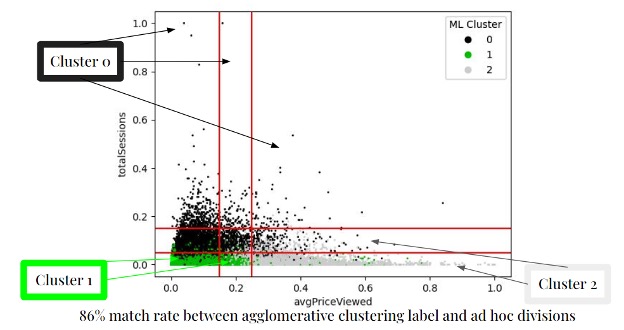
Note that Cluster 0 consists mostly of clusters with high total sessions on our eCommerce platform. Conversely, Cluster 1 consists mostly of customers with fewer total sessions on the platform and who viewed low-price items. Cluster 2 consists mostly of customers with few total sessions but who viewed high price items. Those divisions can be represented by a series of vertical and horizontal lines overlaid on the scatterplot as below.
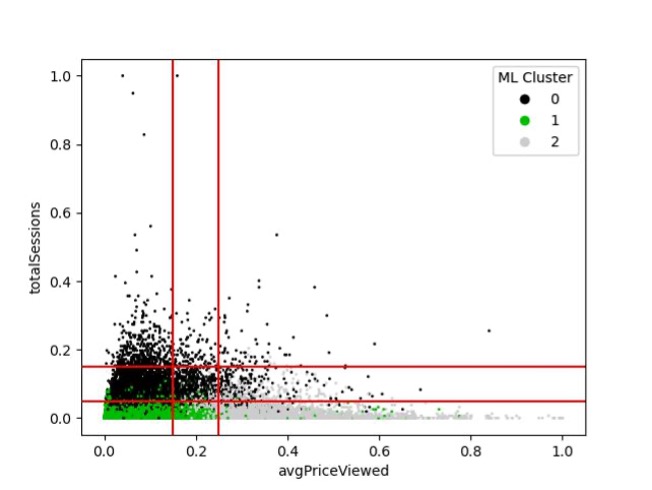
If we consider those lines as creating nine sub-spaces and identify the predominant cluster in each sub-space, this can function as an estimate of the machine learning clustering algorithm.
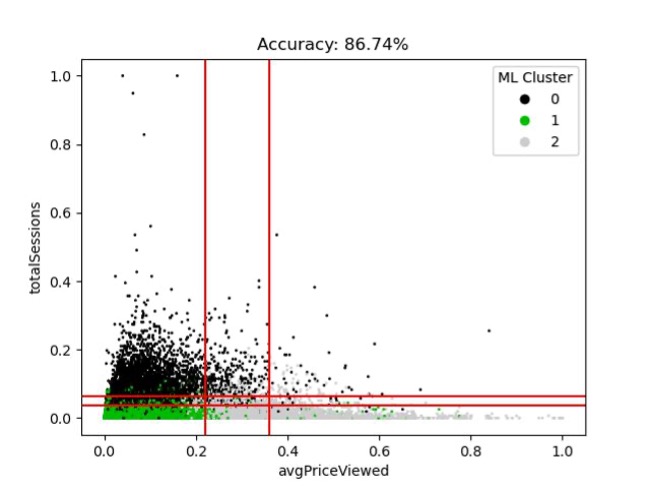
We can iterate through potential line placements to improve the match rate between the algorithm and the estimate.
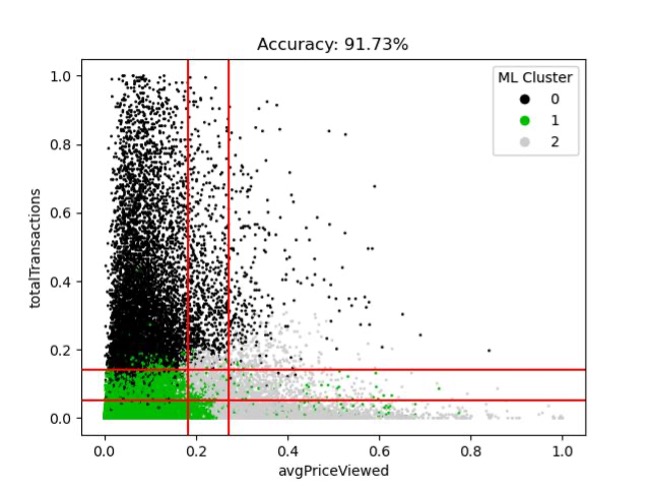
And from there we can cycle through pairs of features to find the one that gives the best fit.
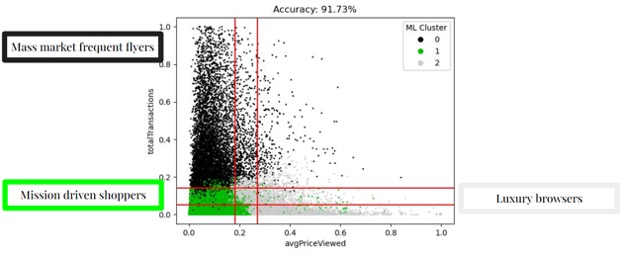
From there, it’s simple to understand which customers are grouped into each cluster and place them in a useful context for business needs.
The above-described hybrid method harnesses the benefits of the precisely identified customer groups produced by machine learning clustering methods and of the simple business profiles created by rules-based segmentation methods. By bridging the gap between accuracy and simplicity data scientists can fulfill their role while catering to the goals of business stakeholders. For more information about customer segmentation or other data science-related topics, make sure to follow our blog. If you have a more specific question or would like to utilize our dedicated team of specialists, contact us today.